You don't have to use tables to represent information.
In this series of newsletters I am sharing my personal views on a more standardised and versatile IT architecture. This week I want to share ideas on how information can be represented.
This may seem silly. Over the past 20 years or so, IT has standardised on relational databases and table-based information representation.
Although the relational model is very effective, it has limitations.
To get around these limitations, many applications implement more dynamic data structures on top of a relational database. For example, many systems use key/value pairs for user-defined properties, or present the user with ways of visualising and setting up hierarchies. Although this can add some flexibility, it is still limited by what the database designer has catered for.
Part of my vision of the universal business computer is that it is versatile and capable of meeting any business requirement. It is also an order-of-magnitude cheaper than conventional approaches. In my current thoughts, the best way of achieving this is to move away from the table as the main information representation metaphor. Instead, data is held in a directed graph, what I like to call a data graph.
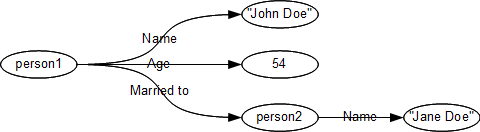
In a data graph, any information can be represented as a series of objects and values (known as nodes) connected by links (known as edges) that have both direction and data type. For example, here is some information about a person:
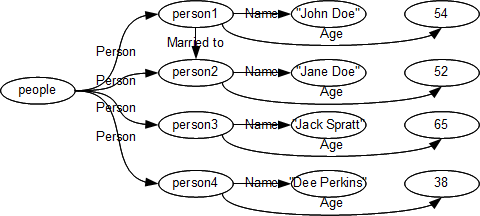
You can use this to represent anything. You can use it to represent a table-like structure.
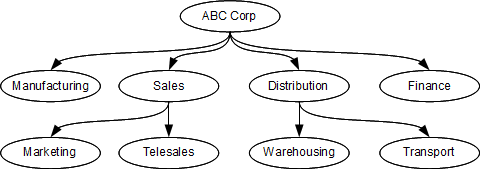
You can use it to represent non-table structures, like this hierarchy of departments.
This is a well-known approach. It is the basis of Resource Description Framework (RDF), which is widely used for describing data on the web.
We use similar structures within Metrici Advisor, with some additions. We have added additional data to reduce the need for small link nodes. We store and automatically recalculate derived data to reduce the traversals through the structure. We support version management, inheritance, auditing change, and permissions.
I imagine you are sceptical about the need and practicality of a new way of representing information. I certainly would be. In the next newsletter, I will share some ideas about how to add meaning to information, which is where the data graph approach is really valuable.
The next newsletter will be published on 10 January 2012.